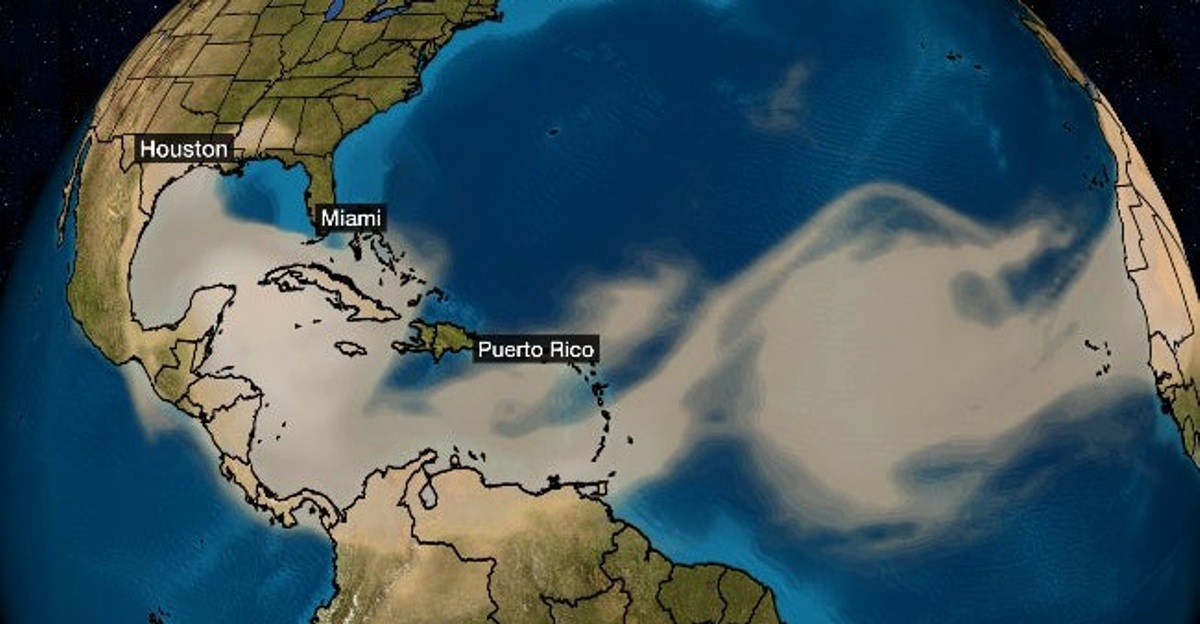
Dust-model forecasts showed some days ago how the Caribbean and the mid-Americas will be affected by this huge dust outbreak and already the Caribbean are heavily impacted.
On the compilation of satellite images below, downloaded from NASA's world view website representing daily images from 9-23 June, one can see that actually the whole month of June there have been large dust outbreaks but that as of mid June the dust started its way across the Atlantic Ocean. The first of two large dust clouds has reached the Caribbean already and is expected to hit the Americas in the next few days.
The orange-brown colours are Saharan dust. Also in this picture are beige diagonal bars (from top left to lower right) which are caused by sun glint.

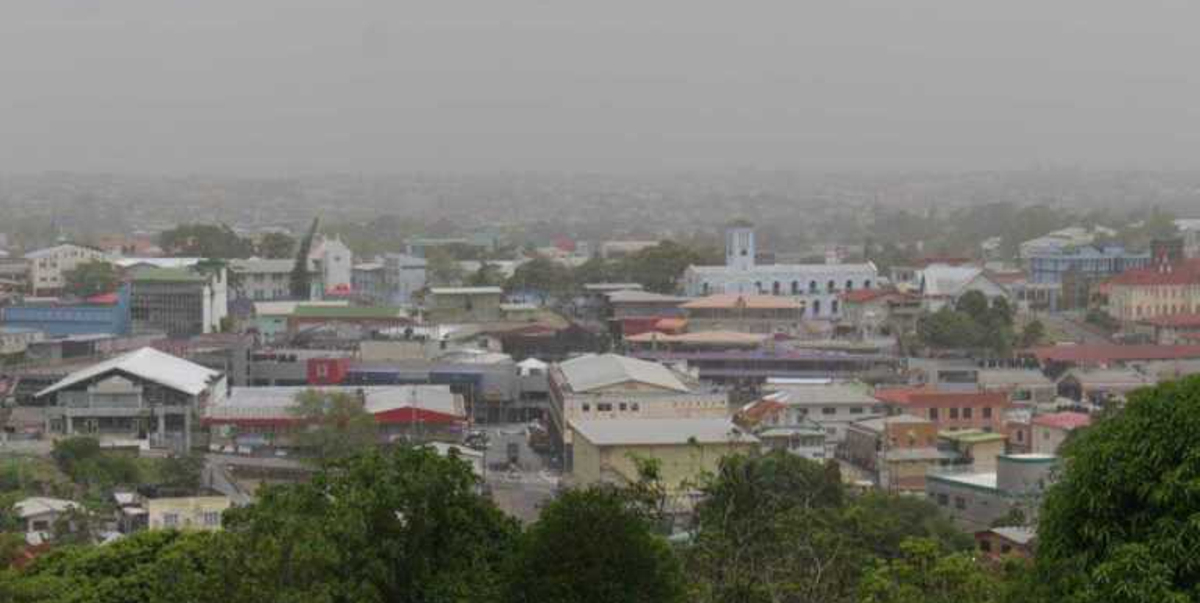
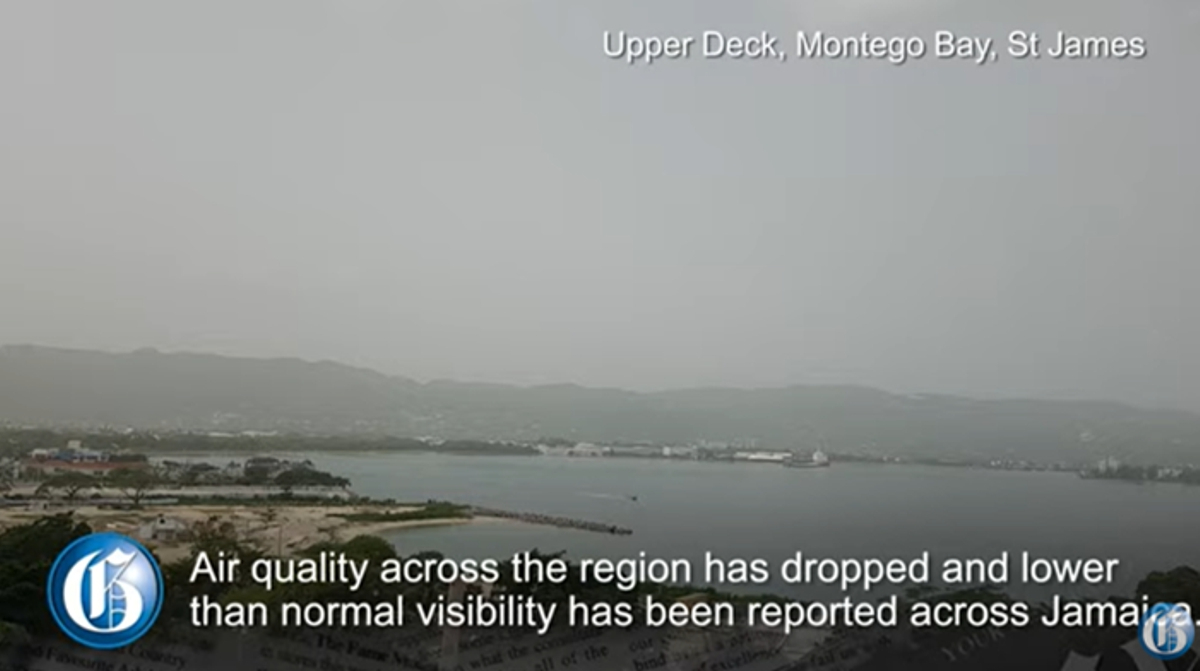
What can be seen on these satellite images is also very evident "on the ground"; since Sunday, reports have been coming in of hazy skies in the Caribbean. The dust impacts both visibility and air quality; people with respiratory issues are warned to stay inside.


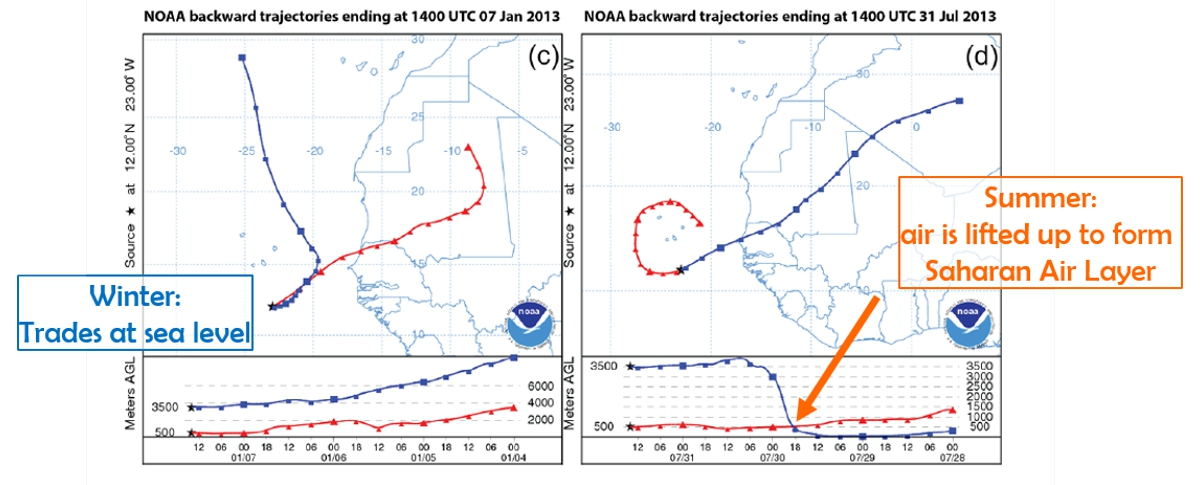
Although Godzilla is a particularly large event, Saharan dust making it across the Atlantic Ocean is a typical summer feature. Millions of tons of fine-grained particles are lifted up into the air over the African continent and thanks to the large temperature difference between continental air masses and oceanic air masses, the dust-laden winds are pushed up to several kilometers in the atmosphere. This process is nicely illustrated in the figure (from the paper by Michèlle van der Does et al., 2016) below:

On this figure you see air-mass back trajectories calculated with NOAA's HYSPLIT model, which allows one to calculate where the air mass at a given point in space and time "came from". The maps show where the winds at different levels originated from, the lower profiles show the vertical movements of these winds. The figure shows a typical winter (left) and summer situation with the red line showing the low-level winds (500m) and the blue line the high-altitude winds (3500m) arriving at the position where dust-collecting buoy Laura is moored, south of the Cape Verde Islands. The winter case shows how the Trade Winds at sea-surface level are the dust-carrying winds whereas in summer, the surface winds that blow across the continent get lifted up by the cold air above the ocean (orange arrow). When lifted up into the atmosphere, the dust-laden winds are picked up by the westward blowing Jet Stream, causing the so-called Saharan Air Layer (SAL).
We are monitoring Saharan dust travelling across the Atlantic Ocean since we find that deposited dust particles have many marine-environmental effects. In a recent paper we concluded that Saharan dust only makes it across the ocean in the absence of rain. And now it is getting complicated; dust particles also play a big role in the formation of droplets, leading to cloud formation and eventually leading to precipitation.... Plenty of reasons to study this material in more detail!