The AQUA project aims to fill this gap with a series of campaigns where the absorption of the sound emitted by Pelagia will be directly measured. In the project, to quantify the effect of water chemistry Pelagia will be sailed in different regions of the globe (eg Atlantic Ocean, Mediterranean Sea, Indian Ocean, etc.) characterised by different water chemistry. Along with these expeditions, a series of laboratory experiments will be performed at NIOZ in Texel and TNO in The Hague. In the laboratory experiments, we aim to isolate the single seawater chemical components that affect sound absorption. At the end of the project using the data collected in the field and the laboratory, we will calculate a new algorithm to derive the absorption of sound. The new algorithm will be implemented in climate models to assess the future oceans noise level.
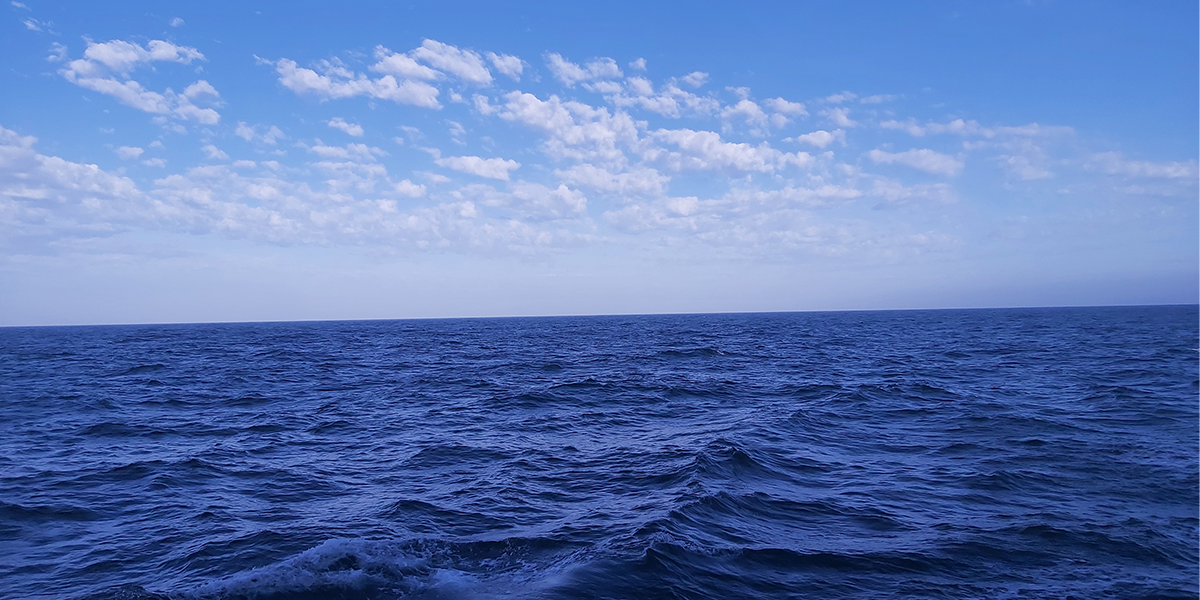
The first expedition started on the 20 of June 2021 from Ponta Delgada in the Azores and ended on the 28 of June 2021 in Reykjavik. During the sailing, we had sunny weather and a calm sea all way (figure 1) and we were able to see several dolphins and a whale.
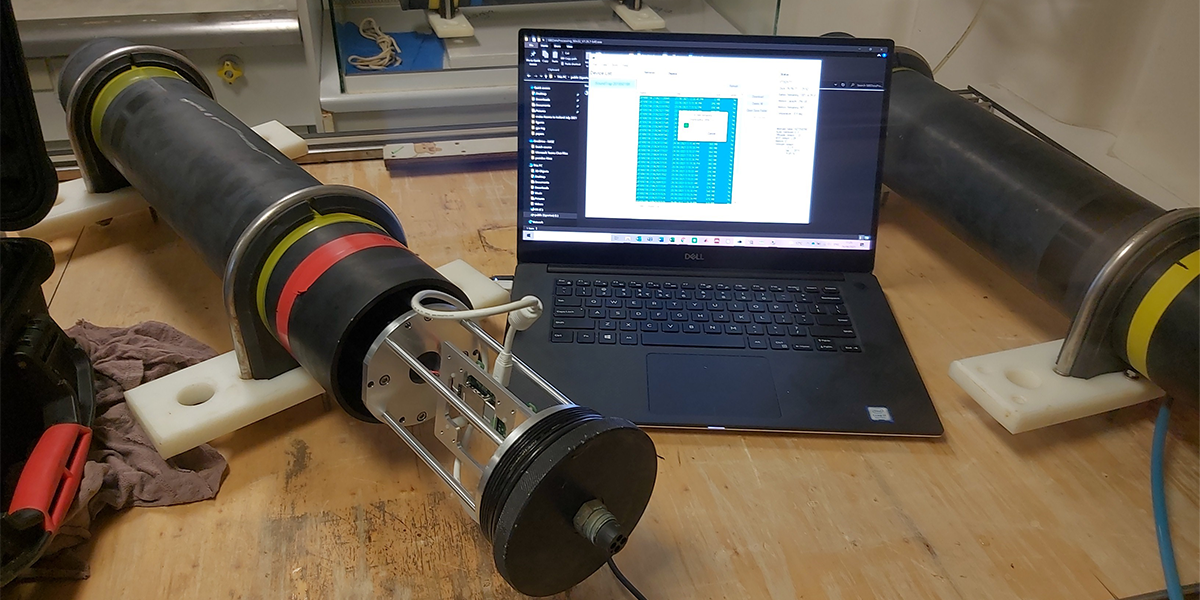
The first days of the expedition were used to test all the equipment. In particular, we tested the three acoustic recorders, the conductivity, temperature and depth (CTD) sensor and the GPS beacon. Unfortunately, the GPS beacon failed and we had to find a new sensor onboard. The three acoustic recorders were programmed with a sampling rate of 144 kHz and the internal batteries were replaced (Figure 2). The replacement of the batteries was necessary because the three acoustic recorders will remain on board Pelagia and they will be used in future expeditions.
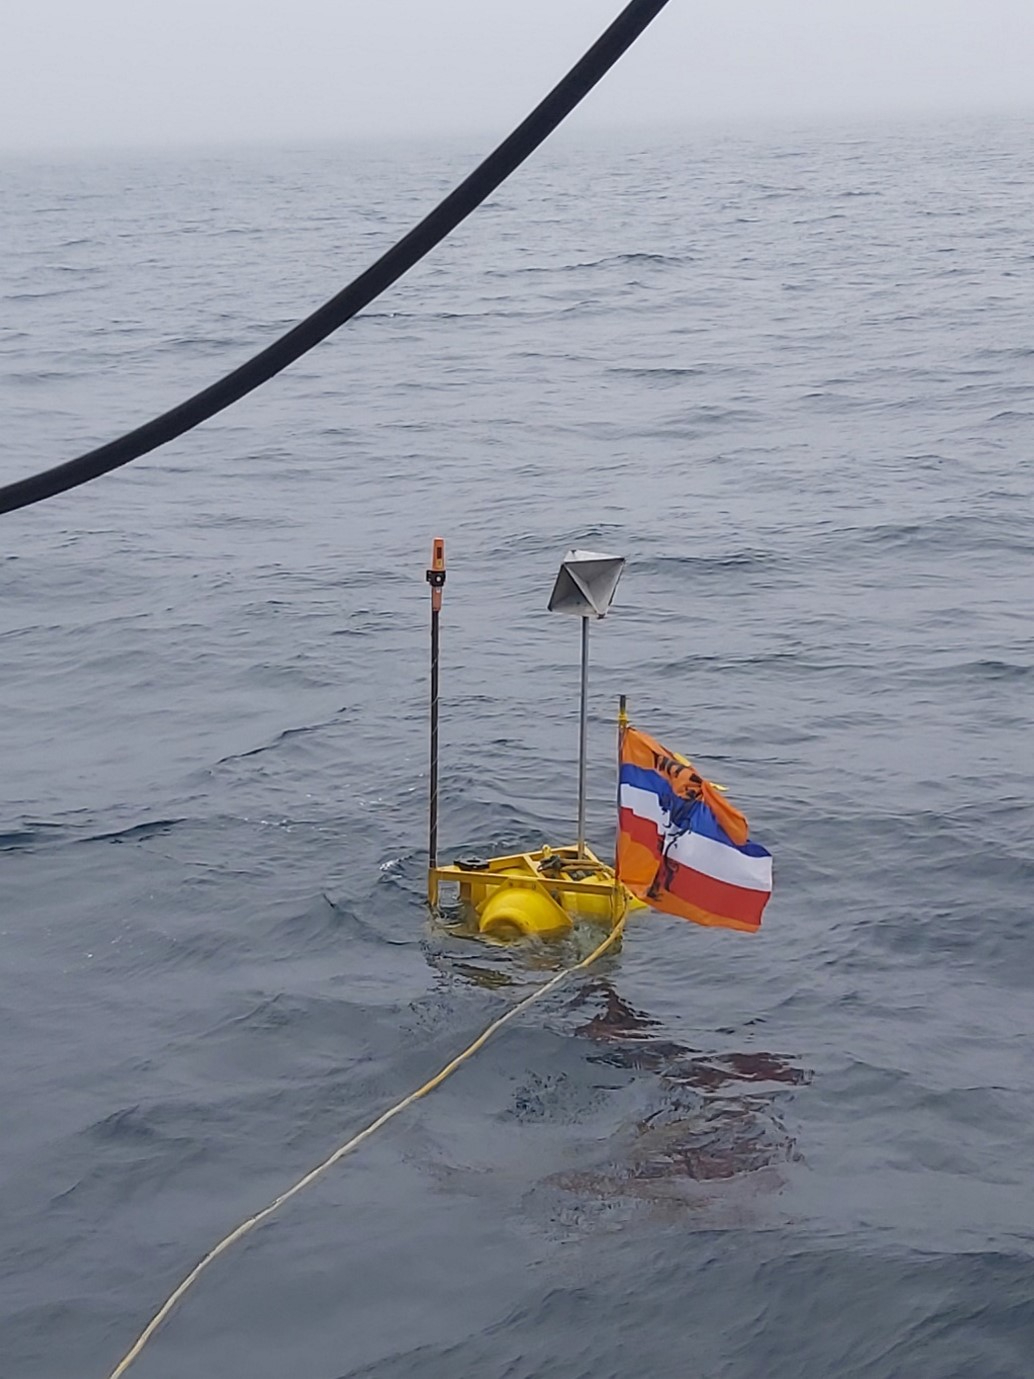
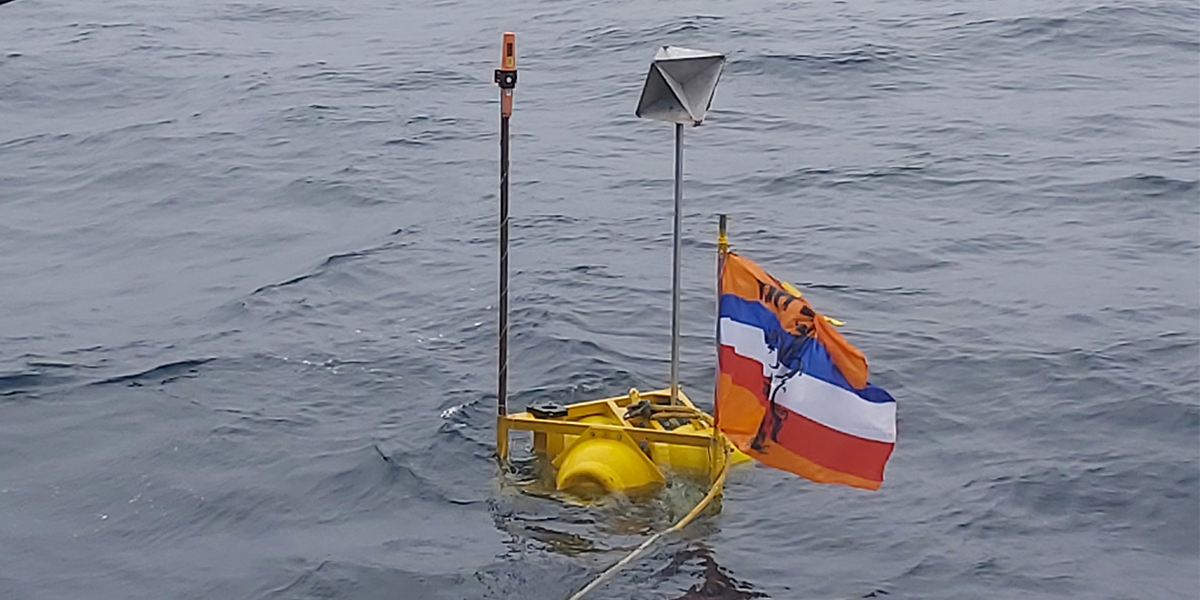
On the 26 of June, twelve hours of sailing time were dedicated to our experiment. During the experiments, we deployed a buoy equipped with three acoustic recorders, a mini CTD sensor, a GPS beacon and a radar reflector to track the buoy position. To facilitate the visibility of the buoy it was equipped with a big Dutch football flag (Figure 3). The acoustic recorders were located at three different depths 40, 80 and 120 m, to assess the changes of the sound profile with depth. The measurement of temperature and salinity was necessary to calculate the sound speed profile. The speed of sound in the ocean varies with depth, temperature and salinity and it will influence the propagation of sound from the ship to the buoy. This information will be used on an acoustic model to isolate the different components contributing to the decrease of sound intensity.
It was the day before the football European Cup game between the Netherlands and the Czech Republic and we hoped that the Dutch flag could bring some luck to the oranje. Unfortunately, the day after the Netherlands lost 2 – 0.
The buoy was deployed at 11:30 and it was recovered at 7 in the evening. To measure the decrease of the ship sound the ship sailed at different distances from the buoy up to 20 km distance. During the deployment, we were surprised to see several dolphins and we spotted the only whale of the entire cruise. On the acoustic recordings, we can hear these marine mammals communicating. Unfortunately, the sound produced by marine mammals masks the sound produced by the ship and it needs to be removed. Other common sources of undesired sounds are the presence of other ships in the region, raindrops and the wind hitting the sea surface. Luckily, we deployed on a sunny day with relatively calm winds (5 m s-1) and we were the only ship in the region. The final hours of the deployment were characterised by an intense fog that made the recovery of the buoy challenging, however in the end we successfully recovered all the equipment.
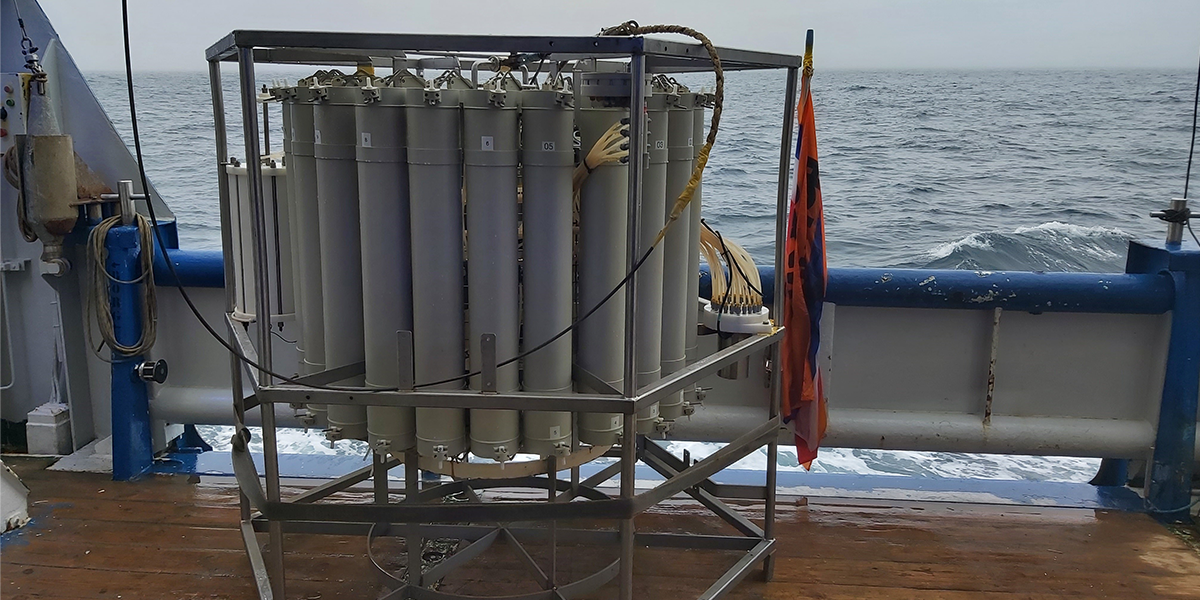
After that the buoy was recovered, we performed a CTD (figure 4) to collect several discrete samples at five different depths (5, 15, 40, 80 and 120 m). These discrete samples will be analysed at NIOZ in Texel to measure seawater total alkalinity (AT) and the total dissolved inorganic carbon (c(DIC)). Using a series of equations we will use these two variables to derive the seawater pH.
In the next expeditions along with the acoustic data, we want to quantify the effect of water chemistry on propeller cavitation. This will be performed by placing a high-speed camera in front of the propeller. Very few experiments were performed to quantify the effect of water chemistry on cavitation. It is unknown what chemical species affect propeller cavitation. Previous studies hypothesised salinity, pH, pressure, temperature and/or oxygen. At the end of the project, we aim to fill this gap by performing the first measurements of propeller cavitation related to water chemistry directly in the field.
Written by Luca Possenti
