OSNAP 2026 expedition: servicing parts of the AMOC monitoring array
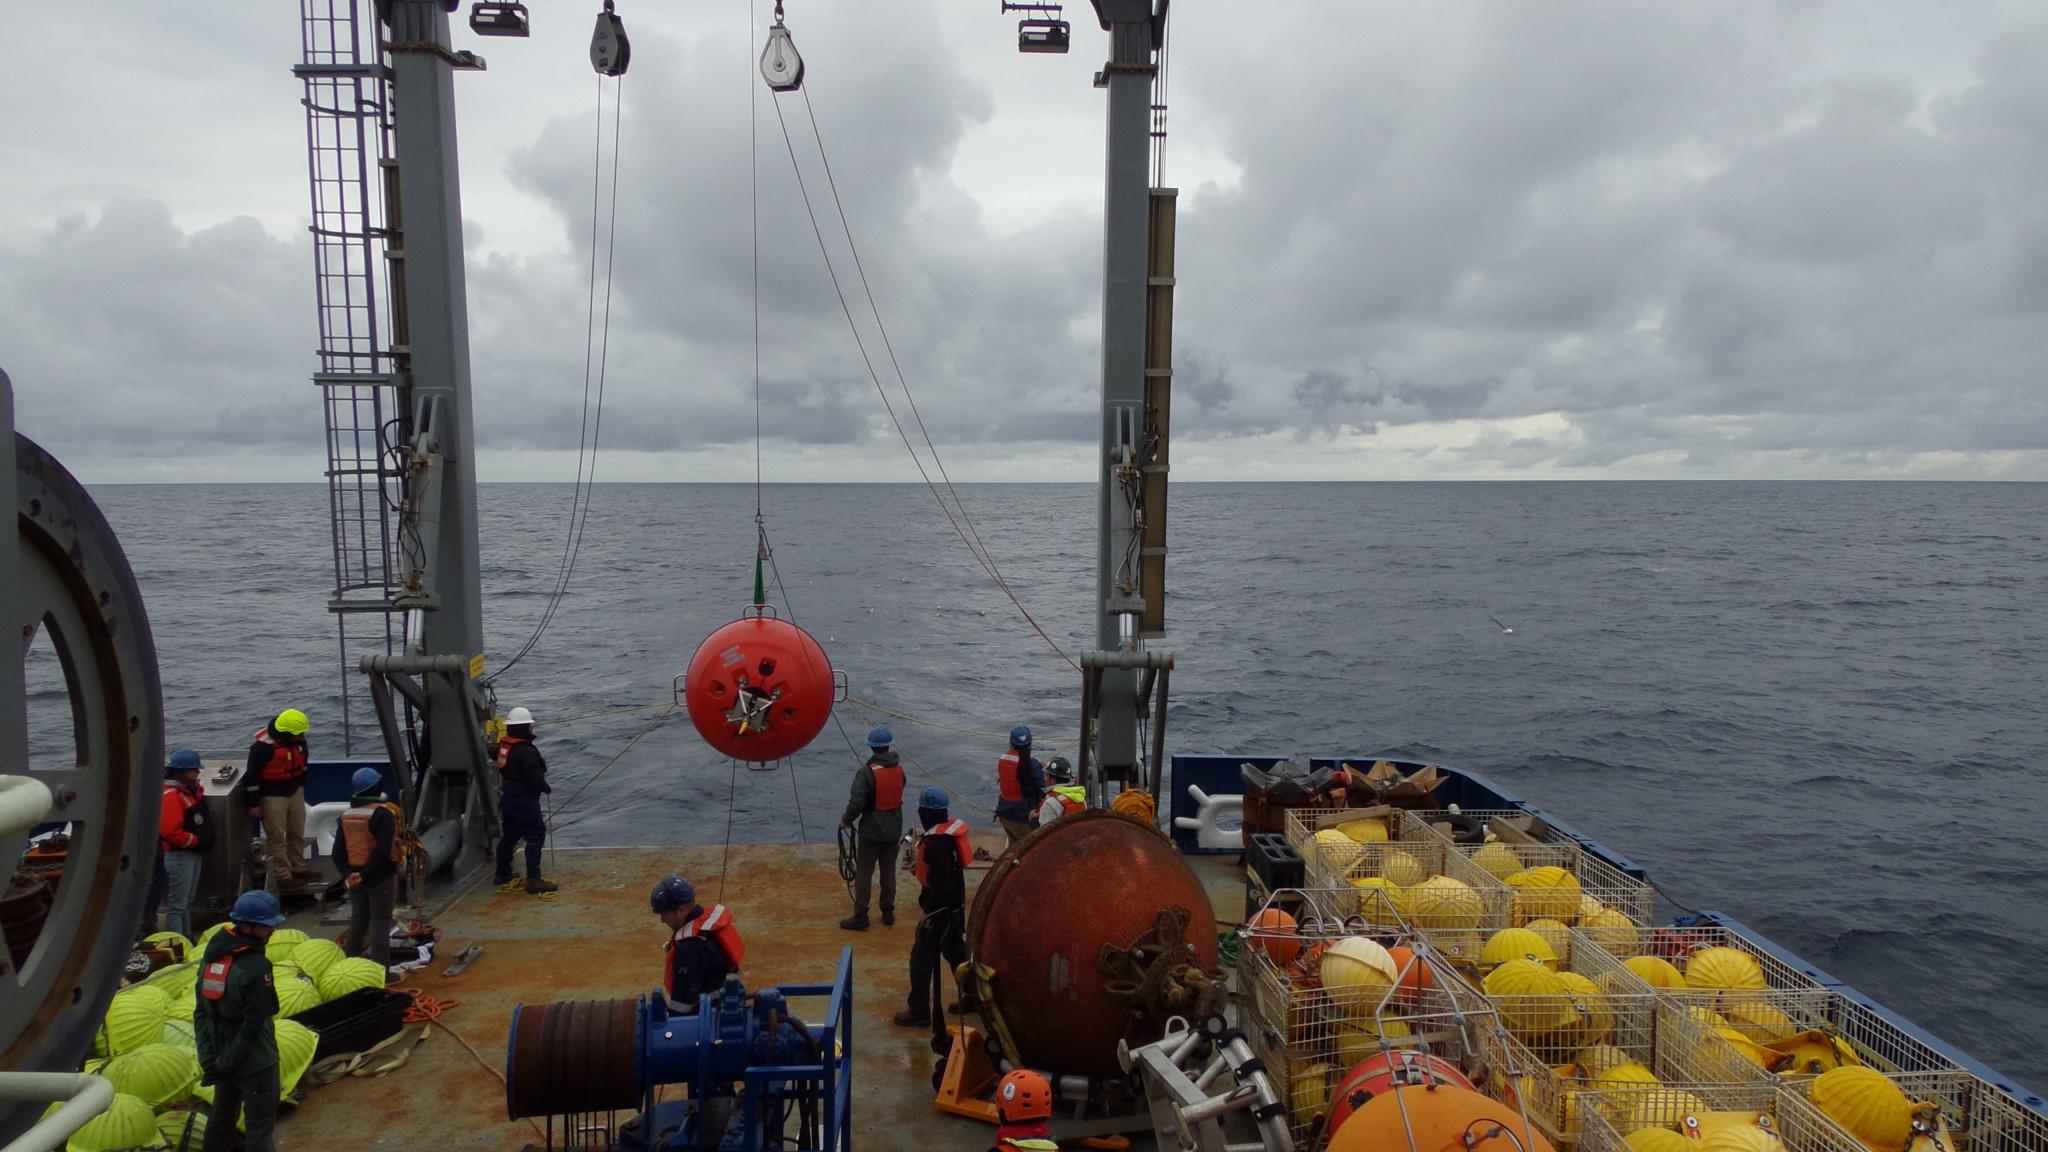
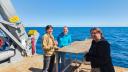
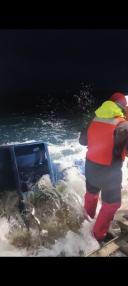
The rear deck, with a mooring ready to be redeployed (photo: Elodie Duyck)
On the 17th of June the RV Neil Armstrong left the harbour of St John’s, Canada, to set sail towards the OSNAP line, an observation array that provides measurements of the Atlantic Meridional Overturning Circulation (AMOC) in the subpolar North Atlantic. During this one-month research expedition we will be recovering and redeploying moorings along the OSNAP array, including five NIOZ moorings. In this blog we’ll be reporting from the ship, writing about our work onboard and life at sea.
9th July 2026
Hi everyone! My name is Reinet, a PhD student at NIOZ and I'm also sailing along on the expedition to the Irminger Sea. In January I started my PhD and my research is about eddies (those are a kind of small whirlpools in the sea that cause mixing) in the Irminger Sea. This past half year I was busy discovering this area through articles, satellite images and underwater data. That's why I find it really nice that I've already gotten the chance to see this area for real so soon. It's my first expedition ever on a research vessel, and I'd love to tell you a bit more about life on board.
A normal day on board begins with waking up after a night that went by peacefully, during which you were rocked to sleep, or not, when your roommate stood cursing in the middle of the night about rolling objects. We spend most of our time on board in the "main lab." This is where the laptops, instruments and big screens for keeping an eye on the CTD are located. One day we're busy with our moorings, the other day we do CTDs during the night. What always stays the same is securing all the stuff. During a big wave you don't want your laptop or expensive measuring instrument to get thrown onto the floor. Or as a colleague here says: it's been moved by the invisible cat.
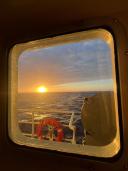
Sunset from the cabin (photo: NIOZ)
On some days there's time to exercise. That's definitely needed here with the combination of an American kitchen and an average of 2000 steps a day. Hidden between the servers, behind a watertight door and a narrow ladder, lies the gym. Among pipes, fans and unfamiliar sounds, a few weights and machines have been placed. The first few weeks I was quite fanatical here, but as the waves get higher, it turns out to be a bit harder to run a kilometer or to get those kilos up in a squat. What also doesn't help is Cheese Thirty, the fixed snack platter at half past two in the afternoon.

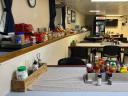
The daily charcuterieboard (photo: NIOZ)
Together with the unlimited amount of chocolate, noodles and chips, this boat is above all a test of self-control. There's also always "bug" juice to be found in the kitchen. The color changes every week, but the taste of the lemonade stays largely the same: very sweet.
The mess with unlimited snacks and a lot of sauces (photo: NIOZ)
The gym in the vessel (photo: NIOZ)
The strangest thing remains the shifting times. As I said earlier, there are day and night shifts, which don't always overlap. So there's always someone sleeping, and "good morning" and "good night" get said at every moment of the day. Right now it's half past 5 in the morning and after my shift I'm off to bed. My breakfast will soon be someone else's dinner at 17:00. See you then!
On sunny days we can enjoy the sea without wearing a jacket (photo: NIOZ)
7th July 2026
My name is Jelle, and I am a PhD candidate at Utrecht University, where I study oceanography using mainly ocean models. Observations are not really my cup of tea, and so I was very lucky to be able to tag along on the OSNAP 2026 cruise. This way I get some first-hand experience in how observations of our ocean are conducted, which are vital to verify the models we use to understand the ocean’s dynamics and to predict its future. Observations of the ocean currents are not only made using moorings, but also by casting a so-called CTD.
CTD stands for Conductivity, Temperature, and Depth. It is a large machine that is slowly lowered into the ocean, and then lifted upward again. This is a CTD cast. At each depth it records both temperature and conductivity of the surrounding waters, where the latter is used to compute the water’s salinity. Additionally, at certain depths a water sample is taken and brought along with the CTD to the surface.
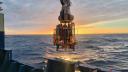
CTD deployment at sunset. Gray bottles collect water samples, central sensors measure conductivity and temperature, and yellow units are test mooring releases (photo: NIOZ)
I am part of the night shift, who are responsible for the casts between 8 pm and 4 am. We start by prepping the CTD: this includes flushing the conductivity and temperature sensors with freshwater and opening the bottles. Next, together with the winch operator, we slowly lower the CTD into the water. From thereon it descends for nearly an hour to reach a depth of roughly 3 km.
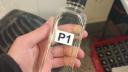
A bottle of Denmark Strait Overflow Water: this water was sampled at 2800m depth near Greenland (photo: NIOZ)
Subsequently, we pull in the rope again. At certain depths we fire a bottle, meaning a bottle is closed and a sample of the surrounding waters is captured. These instructions are given from a “command centre” on board, where the data is collected in real-time. From here the bottom approach is monitored, making sure the CTD does not hit the seabed. Once the CTD is back on deck, we fill small bottles with these samples, which then go to the lab for further testing.
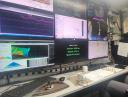
The command centre during a CTD cast with real-time data on sea bathymetry, depth of the CTD and its current read-outs. In the front the usual coffee and snacks.
CTD casts can be repetitive work, but are crucial for OSNAP. Not only do they provide a relatively instantaneous high-resolution depth profile of the water column, but they are also used as a calibration for the mooring data. These casts are for example done near the mooring sites. This way we can compare the CTD’s results to the mooring’s measurement in order to check the accuracy of the mooring’s instruments. In turn the CTD’s accuracy is checked using the samples we got from down below. By doing so every instrument reading can be indirectly compared to a first-hand measurement of a deep-sea water sample in the lab right here on board.
Sampling during rough weather can be challenging... (photo: NIOZ)
3rd July
By Mathilde Esposito (master student, Utrecht University)
I am Matilde, a Master's student in Climate Physics at Utrecht University, and this is my first time at sea on a research vessel. Our small team consists of Elodie, a postdoc, Jan Dirk, our technician, and Reinet and Jelle, both PhD students. Together we are responsible for the Dutch moorings, and this past week was mooring week for us. We recovered and redeployed two of our moorings, IC0 and IC1. Each recovery and deployment takes a full day of careful, coordinated work, in which everyone has a specific role, and nothing happens by accident.
During the recoveries, I stayed inside with Elodie, downloading the data from each sensor the moment it came up out of the water. We fell into a really nice rhythm together, just the two of us and a stream of incoming data, and at some point it hit me: this is what being a real scientist feels like. Not the version from books, but the actual hands-on and slightly chaotic version.
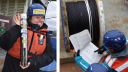
Mathilde holding a Microcat sensor (left) and looking at the mooring setup (right)
My favourite moment, though, happened out on deck during the IC0 deployment. The Microcats, small instruments that measure temperature and salinity, had been tested the night before by briefly lowering them into the ocean, a procedure called CalDip. While Jan Dirk and the other technicians were busy sending IC0 back into the water, Reinet and I were working alongside them, removing the Microcats from the CalDip frame to prepare them for IC1's deployment in the afternoon. Since we're on the American vessel R/V Neil Armstrong, the ship's own drill was not fitted for our metric bolts. So while Jan Dirk used NIOZ's own drill to get the job done in seconds, Reinet and I were stuck doing the exact same task with two tiny wrenches. Looking back, it's one of those small, ridiculous moments that end up being the ones you remember most.
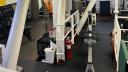
Working on the deployment of the 'Smartie' mooring
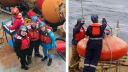
The day after, we deployed IC1, and this time the five of us were all out on deck together, watching the mooring we had spent the previous day preparing disappear back into the water, ready to collect data for the next two years. There is something quite special about standing there with the people you have worked alongside, watching the result of that work sink out of sight.
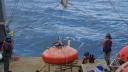
Preparing the 'Smartie' for deployment, a buoy with a current meter that measures the speed and direction of the currents. The nickname comes from how much it looks like the colourful candy.

Reinet and Matilde on deck taking notes of the deployment
24th June 2026
By Elodie Duyck
We’ve now been on the RV Neil Armstrong for about a week, and we just reached the Irminger Sea. The Irminger Sea is located east of Greenland, and we will be working in this region for most of the remainder of the expedition. In this blog, I will tell you a little bit more about what we will be doing here in the coming weeks
We are currently servicing the Ocean Observatory Initiative (OOI) moorings and will soon after be heading to the OSNAP array. OSNAP (for Overturning in the Subpolar North Atlantic Program) is an international research project that aims to better understand and measure changes of the Atlantic Meridional Overturning Circulation (AMOC) in the subpolar region. The OSNAP mooring array extends from the Canadian to the Scottish coast via Greenland, and is composed of about 50 moorings, that have been taking measurements since 2014.
Anchored instruments in the ocean current
So… what are moorings? Moorings are cables that are anchored to the bottom of the ocean, and are maintained vertical thanks to flotation buoys. They can be up to a few kilometers deep! Along this cable, we attach instruments that measure water properties at given depths. We are most interested in the temperature, salinity, and pressure of the waters, as well as its velocity. For instance, one of the instruments we use in our moorings is an Acoustic Doppler Current Profiler (ADCP), which can measure the velocity of the water in a range of 500m. Another instrument is the Microcat, which we use to measure the temperature and the salinity of sea water. The instruments that are mounted on the cable store data locally. This means that to obtain the data recorded by each instrument, we need to bring them out of the water with a ship.
Data collection, calibrating, servicing and redeploying
Every two years, OSNAP-scientists therefore go to sea to collect data from the instruments at each mooring location. We release the mooring from its anchor, bring it on deck, download data from all of the instruments, calibrate them, change batteries, exchange old instruments, and finally redeploy the mooring. This is a complex process that can take up to two days for each mooring. In addition to working on the mooring and the instruments, we also make full depth measurements of the water column (called “profiles”). These are used to calibrate the mooring data, and to obtain high-resolution observations of the properties of seawater along the mooring array. We’ll write more about all of this in the coming weeks.
On this expedition, we will be servicing the 11 OSNAP moorings that are located on the mid-atlantic ridge: 5 from NIOZ on the western side of the ridge (the Irminger Sea), and 6 from our US colleagues on the eastern side of the ridge (the Iceland basin). During the summer, other ships will be doing the same in other parts of the OSNAP array. The data we will be collecting this year will allow to build a 12-years timeseries of ocean currents and variability in the subpolar region. This will help to get a better understanding of how changes in this region affect the AMOC. We’ll send updates throughout the expedition to tell you more about the mooring deployment process, the instruments we use, but also our life onboard a research ship.
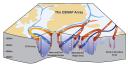
Schematic of the OSNAP array. The moorings we will be recovering and redeploying during this cruise are on the eastern and western flank of the mid-Atlantic ridge (picture: www.o-snap.org.)
What does a mooring look like?
Below, a schematic depiction of one of the NIOZ moorings we will be recovering and redeploying, alongside with photos of all the different parts of the mooring. The photos show flotation buoys, different instruments that are attached to the mooring cable, including an ADCP and Microcats, as well as the mooring anchor. Photos by Nora Fried and Elodie Duyck
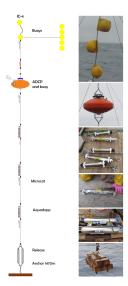
Schematic and pictures showing one of the NIOZ moorings we will be recovering and redeploying (images by Nora Fried and Elodie Duyck)
Linked staff
Elodie Duyck
Postdoc

Reinet Hagen
PhD student

Jan Dirk de Visser
Senior Sea Technician

Femke de Jong
Senior Scientist

Follow updates
See also
“Long-term ocean monitoring is important, especially now”
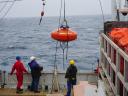
A measuring instrument being lowered from a research vessel to collect research data (photo: Femke de Jong - NIOZ)