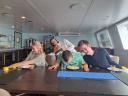
SurfCO2 expedition
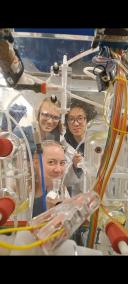
Part of the science team as we set out from Iceland (photo: NIOZ)
In the morning of 3 June we departed from Reykjavik for the next scientific expedition of RV Anna Weber-van Bosse. Over the next two weeks we will travel south down the Atlantic Ocean, through the Strait of Gibraltar, and across the Mediterranean Sea to Genoa.
Final blog 17 June
Written by Matthew Humphreys
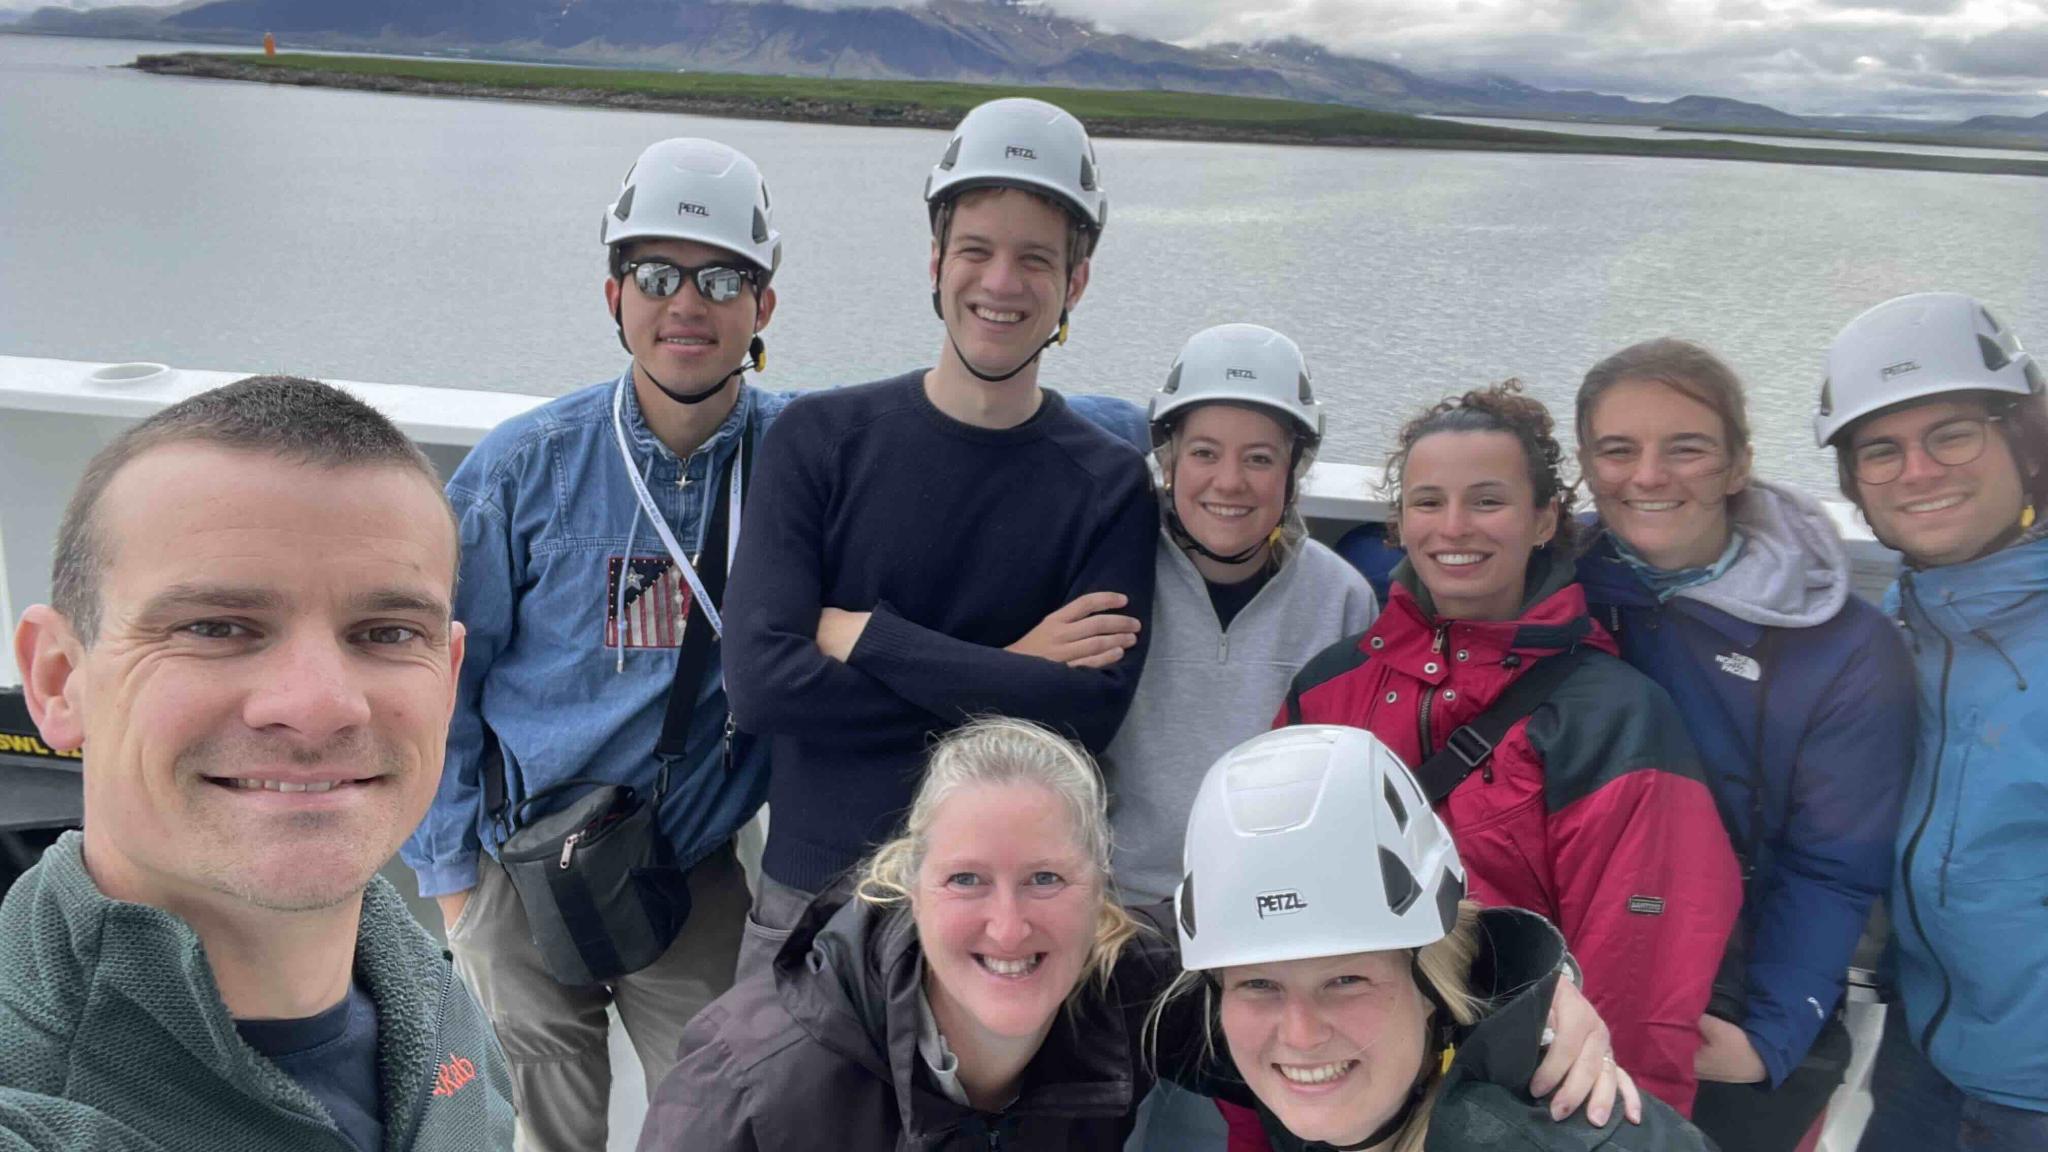
We arrived in Genoa this morning after a highly successful cruise. The scientists and crew rose to meet several challenges along the way, which are always to be expected on any oceanographic expedition, but especially more so with a brand new ship and equipment. We covered almost 6000 km in 14 days, passing through the waters of 7 different countries. We collected over 1500 seawater samples from the sea surface and across 7 CTD stations, and measured many of these on board. We found living foraminifera and had around 100 cetacean sightings, including at least 9 different species and well over 400 individual animals. After a busy final day tidying and cleaning up the ship, we are all ready for a well-deserved rest, before getting back to work to analyse all the data that we have collected. Thank you for following us on our journey!

Expedition photo with all scientists and crew on board (Photo: NIOZ)
17 June
Written by Sharyn Ossebaar
My journey leading up to this expedition actually began back in March when I participated in the first scientific expedition of the Anna Weber-van Bosse. Back then, there were plenty of challenges as the ship wasn't quite ready to have scientists onboard due to the delays from the shipyard. We made it through the first expedition and gave plenty of feedback for improvements, so I was now very intrigued to embark on a new adventure and to discover how developments had been made. I have not been disappointed with how the ship has improved in the past couple of months and it’s great to see how the crew have adapted from the old ship and have become more familiar with this much bigger vessel. Like any new project, it takes time to perfect them such as a new house takes time to become a home.
Measurements on board
The availability of sunlight and nutrients play a crucial role for the production of oceanic phytoplankton which form the base of the marine food web. Knowing the variability in macronutrients (Phosphate Ammonium, Nitrite, Nitrate and Silicate) can help understand requirements between species, environmental conditions and the role of nutrient cycling. At all CTD stations and at regular times from the aquaflow, samples were collected for shipboard macronutrient determination. The macronutrient measurements were made simultaneously on four channels for Phosphate Ammonium, Nitrite and Nitrate, using a continuous gas-segmented flow QuAAtro Auto-Analyser.
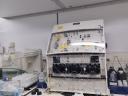
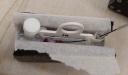
QuAAtro Auto-Analyser that is used for nutrient measurements (Photo: NIOZ/Sharyn Ossebaar)
Together with measuring the nutrients, I have assisted with sampling all the aquaflow samples and distributing the different bottles around the ship. This sometimes feels like I’m a milkman delivering bottles of samples to different containers. The samples from the aquaflow will compare the SEAPOT measurements. It’s also been nice to see so much equipment from the lab on board and having multiple parameters measured simultaneously. During the first few days I was also assisting new people in how to do these measurements.
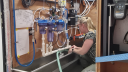
Sampling the aquaflow underneath the SEAPOT (Photo: NIOZ/Sharyn Ossebaar)
We have been very lucky with the weather and the wildlife that was spotted during the past couple of weeks. Some forams have also survived the journey and further science can be continued to find out more about them. The CO2 SEAPOT system will have all the on board data reviewed but the initial conclusion is that it looks very reliable. We have been fortunate with what we have achieved and behind the scenes are the most important people on the ship, the crew. Without these skilled individuals, this cruise would not have been such a success. I’m looking forward to making even more new memories on the Anna Weber-van Bosse.
A crew member ensuring the CTD is safely back on board (Photo: NIOZ/Sharyn Ossebaar)
16 June
Written by Jieran Li
After spending the past five days in the Mediterranean Sea, I cannot help but think of “The Odyssey”. With Genoa ahead of us, our voyage is coming to an end, and most of us will be shortly home thereafter. Even the sea around us looks more cheerful. In her blog of 15 June, Eva already described how the dark grey and tough waters of the North Atlantic have gradually changed into the brighter, lighter, and calmer blues of the Mediterranean.
Our passage up to the moment of writing this blog; sea photos from along the route (Photo: NIOZ/Jieran Li)
From the beginning of the blog planning, I volunteered to write the second-to-last entry because it is a good opportunity for self-reflection, without the responsibility of writing the closing note.
During the cruise, I spent the most of my time assisting Eva with spectrophotometric measurements. From the underway system and CTD casts, more than 300 seawater samples were collected in total and we measured absorbance after adding specific dyes to determine pH and oxygen concentrations. These pH values will later be used for the carbonate chemistry calculations. Shout out to Sharyn and Eva for setting up the experiment/workflow and for their incredible hard work.
Setting up the spectrophotometer laboratory for oxygen measurements (Photo: NIOZ/Jieran Li)
Besides working in the lab, I was also given an unofficial title: "Data Dominator" or, as I would prefer to call it, “Data Dog” because I always have the USB stick around my neck lanyard like a dog with a collar. Being a “data dog” means that every day I make backup copies of the CO2 laboratory data and scanned notebooks and help digitise sampling sheets.
What I learned from this experience is that data is more than numbers in a spreadsheet. Before joining the cruise, most datasets I worked with simply came from clicking the download button. Here, we are measuring everything from scratch. Now, when I look at a measurement record, I can still vaguely remember sealing the sampling bottles, calling out sample numbers for the notebook, and sometimes even which dance music was playing in the laboratory while the measurements were being made.
With the cruise coming to an end, memories emerge in my head: from little seasickness at the start, board games, and terrible jokes at the dinner table to spotting dolphins, mola molas, and sea turtles while crossing the Strait of Gibraltar and a cloudless night filled with stars. Without the cool colleagues around me, I do not think these would happen, except the seasickness one.
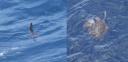
Mola Mola and sea turtle (Photo: NIOZ/Jieran Li)
Well, the danger on the rocks is surely past. Still, I remain tied to the mast. Perhaps soon everybody will be home at last. Until then, we wait for the time to come again.
16 June
Written by Eva Bruins Slot
In today’s blog I will tell you a little bit about my work aboard and share some nice pictures of our trip.
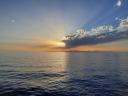
Sunset in the Mediterranean with the Spanish coast in sight (photo: NIOZ)
I recently joined NIOZ as a lab technician in the CO2 lab at OCS. This is my first research expedition ever and I’m doing the oxygen and pH measurements together with Jieran. To explain these two methods in a nutshell:
We fixate the oxygen directly after sampling. Because of this, it is important that oxygen is the first sample to take from the niskin. As soon as I can, I add two chemicals to it and give it a good shake. This will cause the oxygen to be trapped in a nasty, cloudy, light brown precipitate. After that, the bottles will be stored under water until analysis. To measure the concentration of oxygen, a third chemical is added, which causes the precipitate to dissolve and form a yellow liquid. This is measured with a spectrophotometer at 466nm, and the absorbance corresponds to the oxygen concentration.
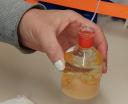
Dissolving the precipitated oxygen in a yellow liquid for oxygen measurements (photo: NIOZ)
For the pH we use the same spectrophotometer, but with a different insert. For this analysis, the samples are loaded in 10cm cells and kept with thermal control before and during the measurement. Each sample is measured before and after adding a special dye, which color ranges from yellowish to purple depending on the pH. Because of the varying color, we measure at 434, 578 and 730nm. When you throw these absorbances in some magical formula, you’ll end up with your pH. Wow!
Adding purple dye for pH measurements (photo: NIOZ)
At the beginning I mainly saw the inside of the container, but especially now we are nearing the end of the cruise, I find myself having more time to spend on deck or the bridge and enjoy the view. Even though there is a lot of ‘nothingness’ around, it does not mean there is nothing to see! There is the wildlife of course, as you’ll read in the other blogs, but also changing weather conditions, clouds lazily drifting by, a lightning cloud in the distance, intense rainbows, beautiful sunrises and sunsets, or sea sparkles and a fabulous milky way at night. Also, the water itself visibly changed during our journey; from dark, icy grey-blue water near Iceland to a bright deep blue in the middle of the Atlantic and in the Mediterranean. As beautiful as it is, no photo or video can truly capture it. I tried regardless and would like to share a glimpse of it with you all.
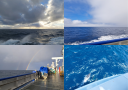
Special moments at sea: sunsets, rainbows, changing ocean colours, and dolphins alongside the ship (photo: NIOZ)
15 June
Written by Shengwei Liu
Today is our final day measuring Total Alkalinity (TA) samples from the CTDs. The whole VINDTA (Versatile Instrument for the Determination of Total Alkalinity and DIC) team—Matthew, Nico, Naniek, and I—has been working hard on this alongside our trusty VINDTA mates: the rather "clumsy" (in terms of precision) R2-CO2 and the "elegant" Furious George. George seemed to be working a bit too hard, got thirsty, and tried to help himself to some water from the nearby tank. It took us a little while to sort it out. You always have to be careful when instruments and a water tank share the same table in a cramped container lab! (Our Chief Scientist, Matthew, can tell you more overflow stories if you’re interested.)
Thirsty George (photo: NIOZ)
The raw TA measurement results can only be treated as rough estimates. The corresponding DIC samples need to be measured post-cruise to calculate the TA more accurately. (Being short-handed, this has to wait until after the cruise.) Additionally, there is a specific experimental design for calibrating and generating the final results. The DIC samples are always poisoned as they must be stored for a long time before measurement because any metabolic activity releasing CO2 would significantly change the DIC concentration in the samples. TA samples, however, can be left overnight unpoisoned because organic carbon biogeochemistry doesn’t have a significant impact on TA over such short timescales in sealed, fully-filled sample bottles (and some of the reactions actually cancel each other out). Inorganic carbon biogeochemistry (i.e., biological calcification), which has a much stronger influence on TA, is generally halted when samples are preserved in dark, stagnant conditions. After shutting down R2 and George, I was feeling so scatterbrained by the end of the day that I nearly discarded an unused fresh sample while washing up the used bottles we had accumulated. Fortunately, I realised my mistake just in time, so the missed TA sample is now sleeping safe and sound in its crate, waiting to be measured tomorrow.
Saved TA sample (photo: NIOZ)
As we approach the Portuguese coast today, we (or perhaps just me, being a first-time sailor) have been experiencing some very unpleasant intermittent pitching, much stronger than anything we've felt over the past few days. This could be down to changes in the ship's encounter angle relative to the waves, or changes in the ocean bathymetry and wind conditions near the continents. But the good news is that tomorrow we get to witness the wonders of the Strait of Gibraltar.
Pitching (photo: NIOZ)
14 June
Land ahoi!
Hello everyone!
My name is Carla and I am the other MMO on board during this cruise. Together with Emilie, I am part of the Atlantic Whale Deal Project. I am currently doing a PhD and working as a research technician at the University of La Laguna. I am originally from Girona, a small city located in the north of Catalonia, Spain, but I have been living in Tenerife for the past four years. So, over the last three weeks, we could say that I have literally crossed the entire North Atlantic.
Yesterday we crossed the Strait of Gibraltar and I was especially excited. My research is focused on the impact of vessels in deep diving cetaceans (i.e. pilot whales, sperm whales) both through noise contamination and collisions. So here I would like to talk to you a bit about our other key players: the vessels.
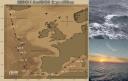
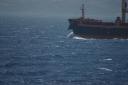
The Strait of Gibraltar is a strategic point on maritime routes as it is a mandatory passage for all vessels whose routes include the connection between the North Atlantic, the Mediterranean Sea and Asia. Therefore, it is one of the busiest shipping lanes in the world. It is estimated that over 100,000 vessels pass through the strait annually. However, if you look at the map, you can realize that it is not particularly wide. Its minimum width is 14 km, and in its wide area it can reach up to 44 km. In fact, as we passed through it, we could clearly see the African coast to our starboard and the Spanish coast to our port.
So, if there is so much maritime traffic in such a small area, why are vessels able to navigate safely and why are there no collisions between them? Well, thanks to the existence of a traffics separation scheme (TSS). This is basically the creation of imaginary traffic lanes that mark the direction of navigation, help maintain order and ensure maritime safety. In other words, it is the highway of the sea.
Anna Weber-van Bosse navigating through the Strait of Gibraltar (photo: NIOZ)
And despite this extremely high volume of maritime traffic, the Strait of Gibraltar is a key area in terms of biodiversity. The confluence of the Atlantic Ocean and the mediterranean Sea, as well as the presence of a complex oceanographic system, makes the Strait an area of exceptional biodiversity. And a prove of it were the number of sightings we had yesterday. We could spot groups of striped dolphins (Stenella coeruleoalba), bottlenose dolphins (Tursiops truncatus), common dolphins (Delphinus Delphis), long-finned pilot whales (Globicephala melas), loggerhead turtles (Caretta caretta) and 26 sunfish (Mola mola)! Isn’t it amazing? We also tried to spot the Iberian orca population, because yes, the Strait is also home to this very significant population which is critically endangered. But this time, we had no luck.
Don’t you think it’s incredible that one of the world’s busiest shipping corridors can also support such a remarkable diversity of marine life? Once again, it reminds us that we all share the ocean, and that learning how to coexist sustainably is essential for its future.
Striped dolphin playing with the bow of a vessel in the Strait of Gibraltar (photo: NIOZ)
13 June
Interpreted and written by Nico Remkes & Naniek Scherpenzeel
Furious George reporting for duty
My peaceful stay in the container came to an abrupt end after being rudely awakened from my slumber. Bright flashing lights were followed by the stomping of heavy steel toed boots and then the real trouble began. Without a moment’s respite, my suffering started as my three greatest adversaries pinched and stretched, pushed and pulled until all of my tubes were back in place. Obviously, I resisted the entire time honoring my name, Furious George! Unfortunately, it was to no avail, even my carefully hidden nitrogen leak was solved with a bypass, and I was deemed healthy enough to start my work.
My “work” involves drinking seawater, a lot of seawater, up to 3 Liters a day! Each small glass of seawater I receive in my stomach takes about 15 minutes to digest, during which I add acid and measure the pH. Some further processing gives an alkalinity value, which is supposedly important to my tormentors but to me it’s just an extra calculation, it is not like I am included in the decision-making process anyway.
Sometimes the strangest decisions are made! Samples provided to me sometimes don’t even reach my stomach, due to problems that I have no control over. While I’m carefully managing a complete orchestra of pumps and valves my “VINDTA team” are distracted by all sorts of things, music, jokes and the local wildlife. Just yesterday they completely abandoned me in the middle of a measurement just to watch some dolphins play around the bow. Nobody seems to understand except my one true friend and colleague, R2-CO2. During floods and storms, he has not left my side once. Lately he has been a little quiet, last week we were both working the entire day but now the seawater seems to be rationed. Every day I have less and less samples to process. R2 has been asleep for a few days now and I’m wondering if we are nearing the end of our journey, maybe I will go to sleep soon as well. I do deserve a bit of a rest after all my hard work, but if I’m honest, I will also miss it a little bit. Even if I was sometimes excluded, I did enjoy the company of my opponents, who I might even call friends now. Their different musical tastes and banter were a lot of fun and I’m glad I got to spend some time together with them.
My view during my hours of suffering (photo: NIOZ)
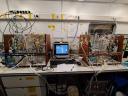
My colleague R2 and I (Furious George) (photo: NIOZ)
June 12
Written by Alessandro Messora
In the search for living Foraminifera our team makes use of both a continuously running plankton pump that filters surface waters, as well as a small vertical ring net that travels through the first 100 to 150 meters of the water column. Both methods result in us dumping the contents of a small cylinder with a fine mesh, called a cod end, into round petri dishes in search of signs of life under our microscopes.
The transparent contents of these petri dishes, when put above a dark background and illuminated from the side, appear to light up like tiny stars in a night sky, revealing the staggering abundance and diversity of this planktonic marine microcosmos: radiolarians, foraminifera, algae, arrow worms, pteropods, ostracods, amphipods and so many copepods! In a single deployment of our small ring net of ~40 cm diameter, there can be several thousands of copepods swimming inside the cod end, outnumbering every other planktonic species by orders of magnitude. Calanoid copepods, in particular, are in fact some of the most abundant animals on the planet. Using their long and bristly antennae as an underwater parachute, they swim and glide through the water column in search of food, such as unicellular algae. In turn, due to their abundance, they represent an essential food resource for marine creatures of all sizes, from newborn fish larvae to baleen whales.
Many copepods possess a single bright red eye spot, and in fact most inhabitants of the water column have evident eyes. This is because the daylight cycle plays an important role in their life: during the day, when predators at the surface could see them more easily, they retreat deeper in the water column and await the cover of darkness to ascend to the surface and feed. In the vast expanse of the oceans, where there’s nowhere to hide, large eyes are also useful to hunt and avoid being hunted. This vast migration to and from the surface, the largest in the world by biomass, could even be observed during this cruise in our samples from the continuous plankton pump. When we left Iceland, which has almost 24 hours of sunlight throughout June, the samples we collected every 8 hours all contained similar amounts of plankton. Now that we have reached latitudes below the 45th parallel and nighttime is longer, samples collected during the day are unremarkable, but ones collected at night are teeming with life, and the mesh of the filter is often clogged.
These tiny, abundant drifters and their daily migrations are not just important for the food chain, but also for the entire ocean’s chemistry: by retreating in deep waters, where they release their fecal pellets after a night of feeding at the surface, they are actively removing carbon from the surface and facilitating its long-term storage in marine sediments.
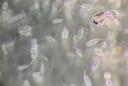
Our average plankton-in-a-petri-dish experience, with hundreds of copepods and a big-eyed amphipod (photo: NIOZ)
11 June
Written by Lennart de Nooijer
Small creatures, gardening and the global climate
During this expedition, a small team joins to collect and grow living plankton. With PhD students Floris and Alessandro and myself we use a vertical plankton net to fish for pelagic foraminifera (see also blog no 2). These single-celled organisms (with the size of a sand grain) are ubiquitous in the ocean and play a major role in the marine carbon cycle. They make a tiny shell of calcium carbonate which sinks to the seafloor after the foraminifer’s death. This continuous rain of carbon from the surface to the deep, has a big impact on vertical chemical gradients in the ocean. Every year, millions of tons of carbonate are thus produced. How these foraminifera will act in the future ocean, is poorly understood. To test this, we have setups to culture foraminifera at the NIOZ. These allow us to mimic various climate change scenarios on shell production by these organisms and predict what will happen to our ocean in the near future.
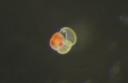
A living planktonic foraminifer, which is a challenge to take a sharp photo of on a moving ship (photo: NIOZ)
However, planktonic foraminifera are notoriously difficult to keep alive in captivity. Benthic species (i.e. those living in the sediment) are much easier to grow. With this expedition, we will try to find out what makes it so difficult to keep planktonic species alive. To this end, we have thermostated lab container with adjustable light sources, two microscopes, pipettes and a gazillion dishes and flasks. We also brought diatoms to feed our foraminifera. Working with living foraminifera is pretty much like gardening. It is often difficult to formalize what you have to do, but it often comes down to develop a feeling for how they look and apply some ‘tender loving care’. We are almost halfway through the expedition and despite some not-so-happy-endings for our foraminifera, we are improving our procedures and have good faith in bringing some healthy specimens home.
Keeping them in the laboratory and analyze how well (or bad) they grow in warmer and more acidic waters is the only way to accurately predict their contribution to the ocean’s carbon chemistry. This in turn, is necessary to predict the effect on the ability of the ocean to take up CO2 from the atmosphere and thereby, on ongoing global warming. Ocean research, such as we are currently doing on board the Anna Weber van Bosse is the only way to collect and study the small creatures that contribute so much to the marine carbon cycle.
10 June
Written by Emilie de Loose
Hello everyone,
This is Emilie from the marine mammal observation team, happy to give you a bit of a glimpse into our research onboard the RV Anna Weber Van Bosse. A few months ago, I reached out to Matthew after noting his survey was travelling through prime whale habitats in the European Atlantic Ocean. I work of the Irish Whale and Dolphin Group on the Atlantic Whale Deal. This project focuses on mitigating against whaleships strikes through various means, including novel technology. Personally, I am evaluating the Sea.AI Sentry thermal camera for its ability to detect the blow of whales in various environmental conditions. The track lines of this survey would give us the perfect opportunity to collect video footage of these blows on the thermal camera to assess the detection distance, the automatic detection software and the effect various weather had on the detections.
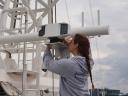
Emilie installing the thermal camera (photo: NIOZ)
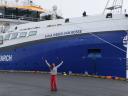
Emilie in front of the Anna Weber-van Bosse (photo: NIOZ)
So, I was delighted when Matthew agreed to bring me, a second marine mammal observer and the thermal camera onboard his ship. Our participation hinged on one condition, if we saw something cool, we had to let the team know. I like to believe we succeeded in that matter.
It was not 30 minutes into our first shift as observers on the bridge when the first whale appeared. A quick and darting minke whale appeared in our binoculars. It was quickly followed by two others within that same hour. With Iceland still on the backdrop, we were soon greeted by pods of white-beaked dolphins darting between the waves. However, that was little compared to what was still to come.
Lightning fast white-beaked dolphin (photo: NIOZ)
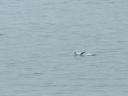
Lightning fast white-beaked dolphin number two (photo: NIOZ)
As I scanned the horizon for more blubber, a large, pitch black, triangular fin suddenly rose from the waves. To provide you with some context, I became a marine biologist due to move “Free Willy” and my subsequent love of killer whales, who I had only seen once on the horizon of a previous survey. This may explain why my brain short circuited when a pod of 7 stunning Icelandic killer whales appeared before us. While we had suspected we may see these iconic apex predators near Iceland or towards the end of our journey around the strait of Gibraltar, seeing them this early in the survey blew us by surprise. To our delight, the killer whales were around long enough for the entire scientific crew to enjoy the view.
Killer whales (photo: NIOZ)
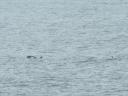
At 6 o’clock we set our binoculars down at the playful chime of the dinner bell and headed down into the mess hall. I was scooping food onto my plate when suddenly a commotion drew my attention to the giant windows by the tables. “We think we saw a whale.”, one of the oceanographers said. So, dropping the tray onto the table, we raced back up to the bridge. There, we had both our camera equipment and the tablet that allowed us to control the thermal camera. Sure enough, two powerful blows appeared not 400 meters from the ship as fin whales passed us by. We swivelled the thermal camera, catching the following columnar blows as they towered above the waves. Their thermal signal in bright contrast against the cold water.
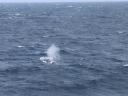
Sighting of a fin whale at sea (photo: NIOZ)
7 June
Written by Nico Remkes and Naniek Scherpenzeel
How to stop sliding around on a rocking boat (with physics)!
For the last few days we have been enjoying the vast expanse of the ocean, with some nicer and some rougher weather. With rough weather came big waves! These waves create challenges in our daily lives on board. In the lab containers stuff started moving, but there was nothing a little yellow tape could not fix! The ping-pong tournament also gained another dimension, those unable to adapt quickly dropped down the leaderboard while those with better sea legs succeeded. But the topic of this blog is about how to eat your dinner without bumping into your colleagues.
Despite anti-skid measures on the table and the floor some bigger waves still managed to create a situation where some people slid around and others didn’t. This caused a heated discussion about the correct way to prevent sliding around. Some argued the best way to deal with the situation is to push up from the table to keep yourself steady, while others strongly advised pressing yourself down and hold the table from underneath.
So let's put this discussion to rest and do some physics!
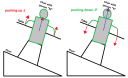
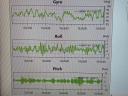
Physics sketch Caption: Simplified force diagram showing the normal force in two scenarios (photo: NIOZ)
First of we need to determine the important forces at play in both scenarios: namely we have a gravity force (Fz) working towards the bottom of the ocean. Second, we have normal force (Fn) working perpendicular to the deck of the ship, at an angle with the gravity due to the ship movements and waves. Last, from high school physics we know that the friction force is proportional to the normal force. Pushing up reduces the normal force, while pushing down increases the normal force. As the friction force counteracts the gravity component along the deck, a lower normal force results in a lower friction force and therefore sliding at lower angles (between the floor and the sea), making the slide look silly.
Surprisingly in an experiment performed during lunch most (unwilling) participants choose neither option, and simply decided to pull themselves in the opposite direction as the sliding direction. Which is more efficient but requires knowing which way you are sliding, a notoriously difficult task. The database of sliding incidents will be expanded on during the remainder of the cruise. Novel techniques to prevent sliding during dinner are tested and improved throughout the cruise. To protect the participants all data has been anonymised.
Picture of Matthew taped to the table. Initial tests show great improvement in dining efficiency (photo: NIOZ)
5 June
Written by Jieran Li
Compared to the atmosphere, the pCO2 in the surface ocean is much more variable. Atmospheric CO2 around the globe currently hovers around 432 ppm, while surface pCO2 can range from as low as 150 μatm in the polar waters up to 800 μatm in the tropical waters. Temperature plays the major role here, but biological productivity is also important.
As our cruise sails southward from Iceland into the North Atlantic,, we are using the SEAPOT underway system to measure pCO2 in seawater and air simultaneously. On 3 June, when we were still on Iceland continental shelf, the pCO2 seawater measured there was about 350 μatm. As we moving further offshore, this value increases to around 430 μatm.
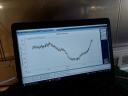
Realtime display of surface seawater pCO₂ measurements as we leave the Iceland Basin (photo: NIOZ)
So, what caused this change? One explanation is that the coastal waters around Iceland has higher productivity, with phytoplankton consuming CO₂ through photosynthesis and therefore lowering seawater pCO₂. In mid North Atlantics, productivity becomes weaker or located deeper, resulting higher pCO₂ values at the surface.
On the cruise
The waves are getting bigger, and some first-time sailors started to feel a bit seasick. I am no exception, but now I am used to the constant swinging and sometimes even feel like a baby in the cradle.
On the third day of the cruise, our crew conducted a CTD at 10 am. CTD allows us to investigate the carbonate system in the vertical profile. It also provides an opportunity to compare our observations with CTDs from before, helping to ensure consistency between datasets.
Collecting seawater samples from CTD Niskin bottles for carbonate chemistry (photo: NIOZ)
The foraminifera team is being productive, as they have found many alive forams. Now the tricky part is to keep them alive before they can be cultured in their new home in Texel.
More work is coming up, as we are soon heading to the main CTD stations, where we will deploy CTDs to depth of 3,750 metres. Exciting!
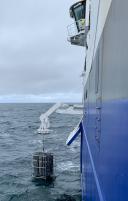
Recovering an Apstein net from the plankton pump (photo: NIOZ)
4 June
Written by Floris Helmendach
We had a great day yesterday, with beautiful weather and a dinner that was interrupted by two fin whales! Today, the weather was not ‘great’ but ‘normal’ according to the captain, which meant that the ship was moving and we had to get accustomed to the rhythm of the sea.
We took the first CTD today, which is a system to collect water at various depths and measure important properties of the seawater. More about these CTDs in a later blog!
CTD being lifted from the water (photo: NIOZ)
We also fished for foraminifera today, which are single-celled organisms that form tiny shells. Our goal is to catch them and culture them in a laboratory, so we can bring them home to do experiments. To find the foraminifera, we used a small ring net with a very fine mesh. We find a lot of different organisms in the ring net, such as copepods (tiny shrimp-like animals) so we have to sort through all of them using a microscope, carefully picking out the foraminifera with a paint brush. This turned out to be quite difficult, but we managed to isolate 150 foraminifera, which is a really great result for our very first try! The next challenge is to keep them alive, which involves feeding them algae and carefully controlling the temperature and light. Tomorrow, we will try to test what the best way to feed the foraminifera is. As the cruise continues further South, we will cast out more nets, hopefully catching a variety of different species along the way and keeping them alive as we go.
In the meantime, we have been busy collecting seawater samples, reading manuals for equipment, beating the chief scientist at table tennis and more. For me, it is my first expedition, and working in a lab that is moving continuously is different from a land-based lab. You must be careful with leaving stuff lying around, and any equipment must be secured carefully. Tomorrow, my colleague will tell you more about the CO2 measurements that we are doing on this cruise.
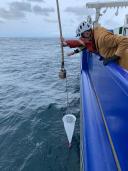
Deployment of the ring net (photo: NIOZ)
3 June
Written by Matthew Humphreys (NIOZ)
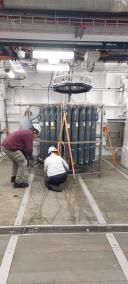
The main aim of this expedition, SurfCO2, is to thoroughly test and validate the underway sampling systems on board. These are a series of sensors that automatically measure near-surface seawater properties, especially related to carbon dioxide (CO2), wherever the ship travels. The data will be contributed to global compilations that are essential for tracking and understanding the changing marine carbon cycle.
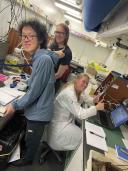
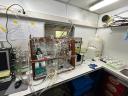
Getting acquainted with the instruments in the CO2 chemistry laboratory (photo: NIOZ)
We will validate the sensors in two ways. First, we have installed a series of extra sensors alongside them to compare the results, some loaned to us by collaborators from the Integrated Carbon Observing System (ICOS), the National Oceanography Centre (NOC, UK) and the Flanders Marine Institute (VLIZ, Belgium). Second, a team will be collecting seawater samples to measure here in the laboratories on board. That will include surface samples for direct comparisons plus deep samples to compare against previous expeditions in the same area.
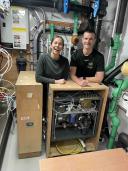
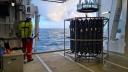
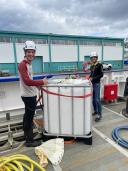
Installing an underway system to measure surface ocean and atmospheric CO2 concentrations (photo: NIOZ)
2 June we boarded the ship after breakfast and spent the whole day installing and testing our various instruments. Several of them are now already up and running and we have started collecting surface water samples at regular intervals. Tomorrow afternoon we will arrive for our first test sampling station where the ship stops to collect seawater from deeper in the ocean.
Alongside this work, another group will be collecting plankton for culturing experiments, and we also have some marine mammal observers on board, who have already been busy with minke whale, dolphin and orca sightings just in the first 6 hours! You’ll hear more from them in future editions of this blog.
Setting up the ‘plankton pump’ on the aft deck to collect surface ocean plankton (photo: NIOZ)
Linked staff
Matthew Humphreys
Senior Scientist

Sharyn Ossebaar
Senior Research Assistant
Lennart de Nooijer
Research Leader
Floris Helmendach
PhD student

Alessandro Messora
PhD student
Eva Bruins Slot
Research Assistant